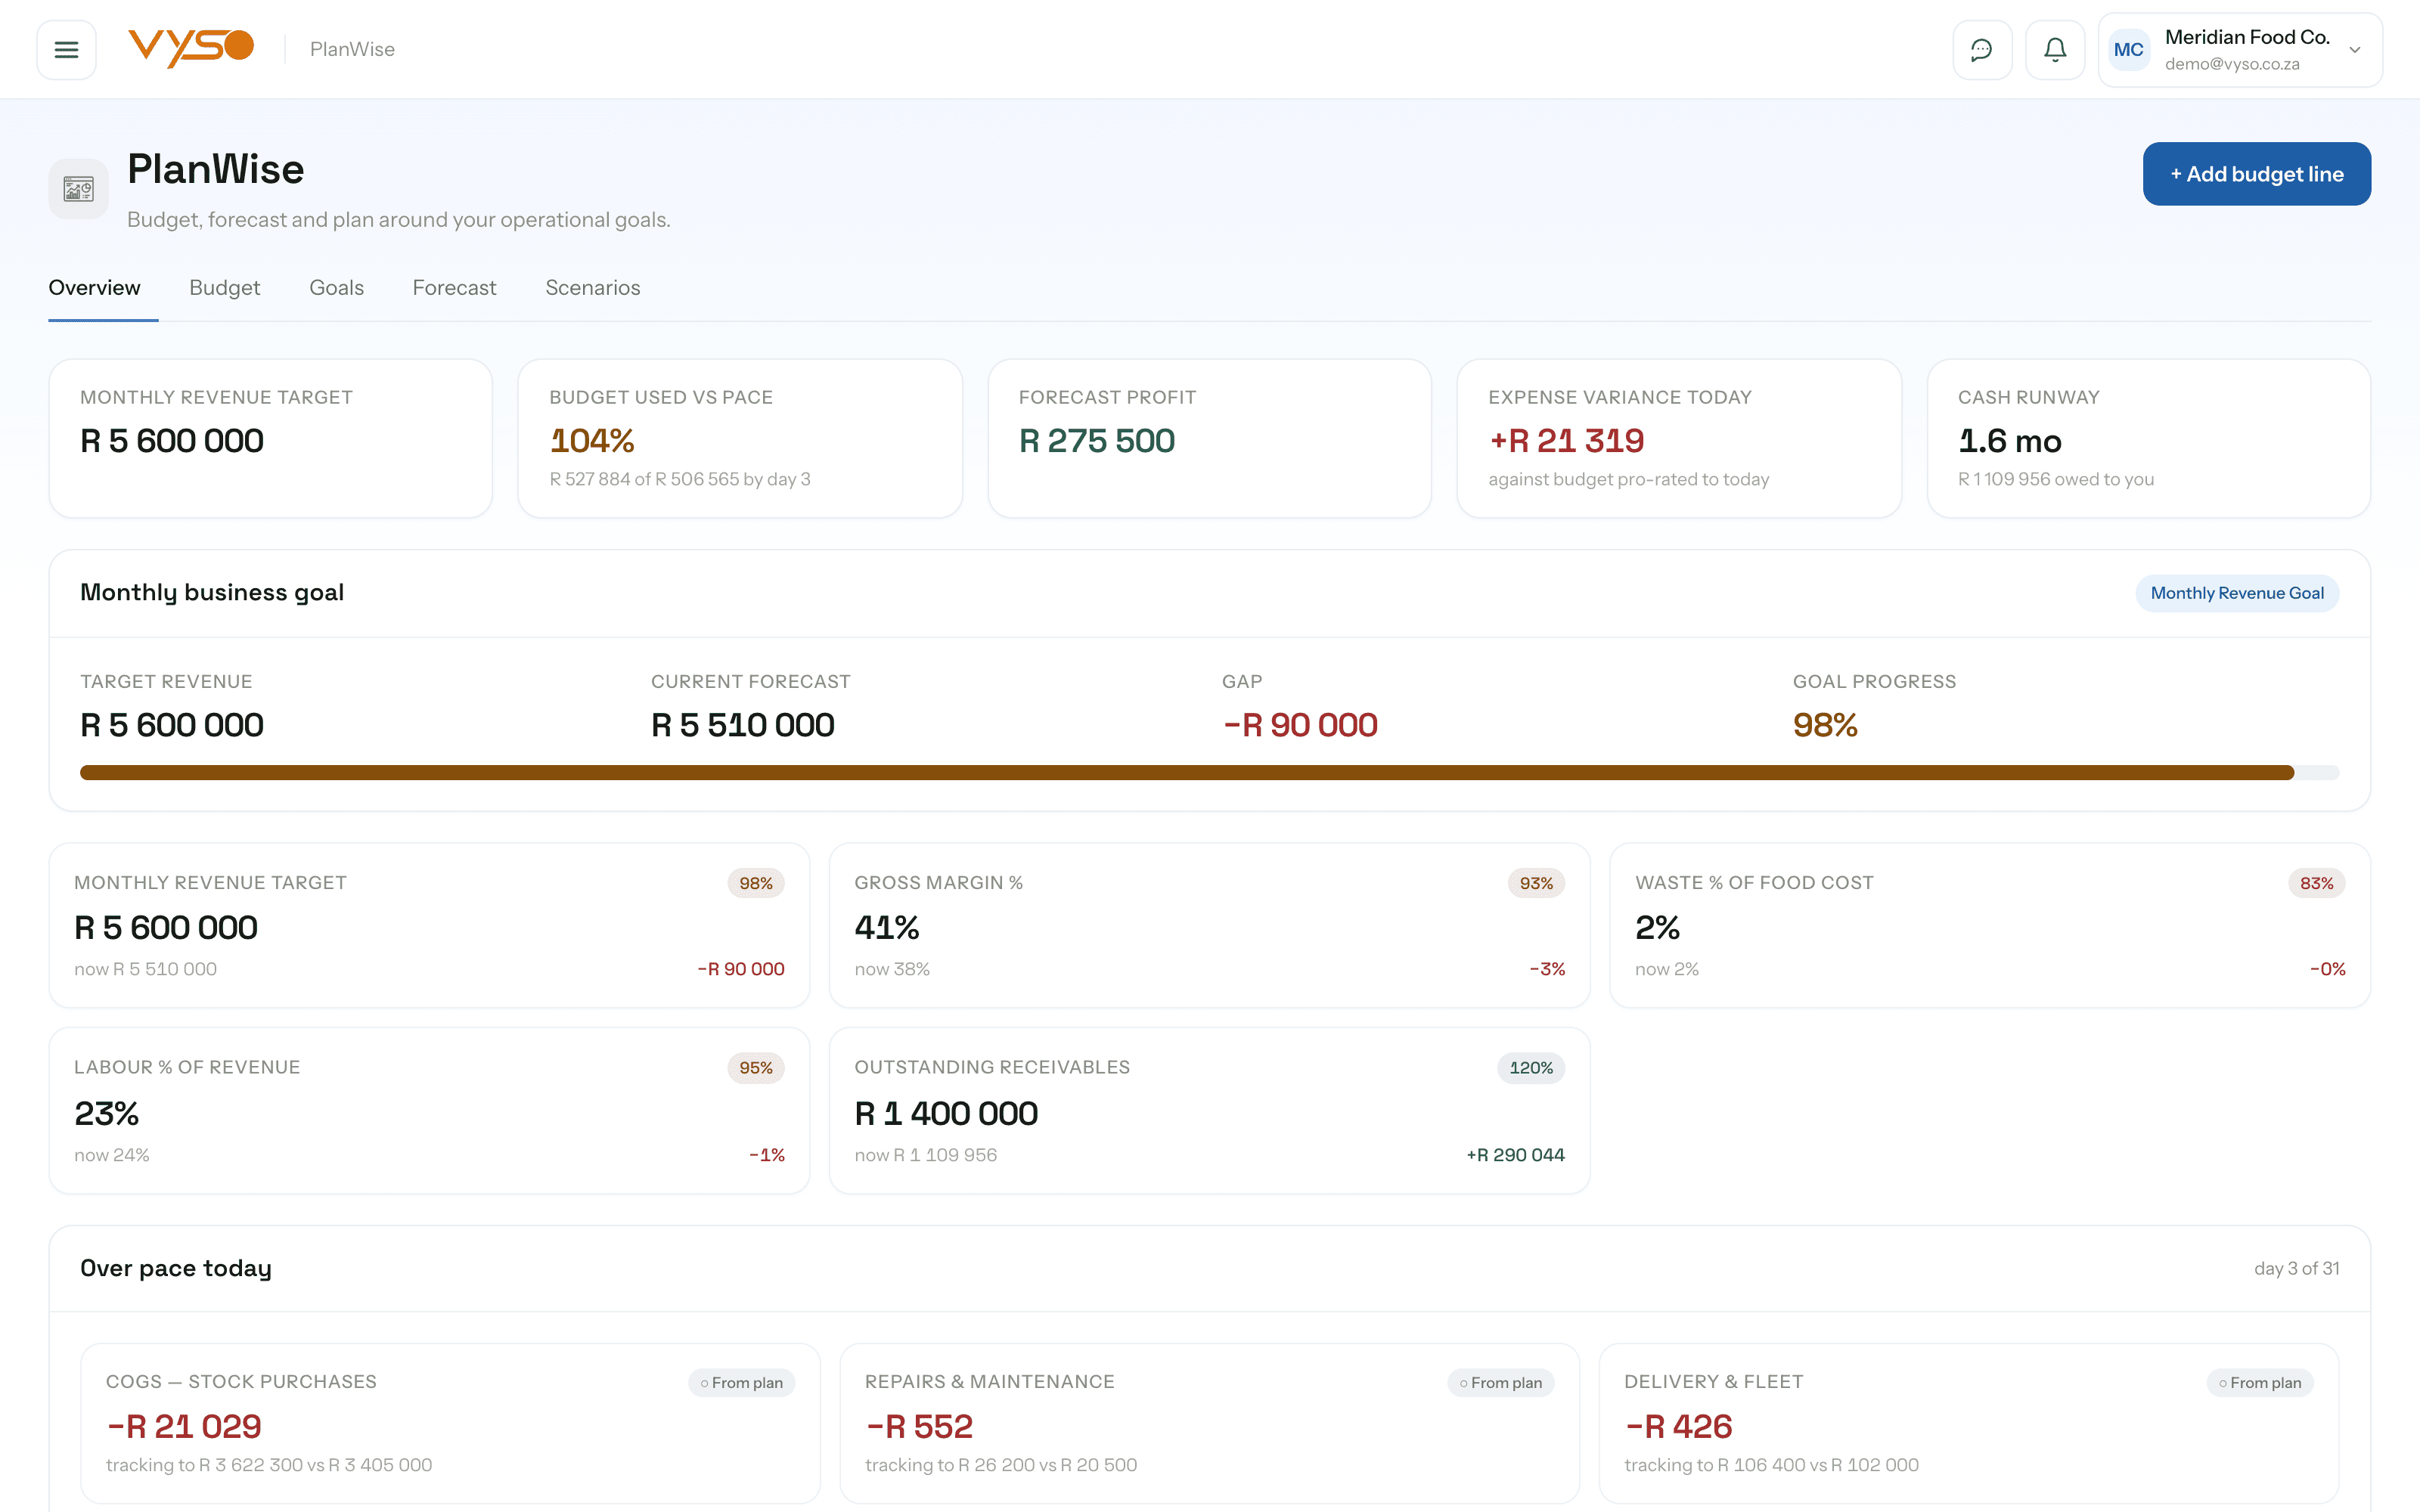
PlanWise.Set the target. See how the operation is tracking against it.
PlanWise sits above the operational modules: you set the budget, goals and forecast, and it measures reality against them live — pro-rated to today rather than flattering you until month-end.
Every screen below was captured from the running platform with a demo organisation — not drawn as a mockup. The labels, columns and tiles are the ones your team would work in.
01
Over budget today, not over budget on the 31st
Comparing a part-month actual against a whole-month budget makes every line look healthy until it suddenly isn't. PlanWise pro-rates each budget line to the elapsed fraction of the month, so on day eight you are measured against eight days of plan. The banner says how much is over pace and across how many categories — same-day, not month-end.
Every category shows Actual so far, Budget to date, Tracking to and Full-month plan side by side
Pace badges run Over pace, Edging over, Within pace, Ahead of pace, Slightly behind, Behind pace or No plan
A source chip marks each line Measured · OrderFlow, Measured · order cost, Measured · WasteWatch or From plan — so you can see which numbers are live
The budget table adds Profit impact, a suggested action and a “Review →” link to the module that can act on it
app.vyso.co.za/planwise/budget
02
The numbers the rest of the platform measures itself against
Goals is where an owner sets the north-star figures once, instead of maintaining a target in every module. Revenue, desired monthly profit, maximum expenses and target gross margin live here — and each field states which module uses it, with a link straight there.
Core goals cover revenue, desired monthly profit, maximum expenses and target gross margin; strategic goals add cash reserve, growth and an outstanding-invoice target
Each goal ring shows progress against target with a “● Live” badge when the figure is measured from real rows
A goal timeline marks month start, today, forecast finish and the goal itself, with an on-track or behind-by reading
The “How your goals connect” chain runs Revenue → Margins → Profit → Cash → Growth, each chip tagged with the module that owns it
app.vyso.co.za/planwise/goals
03
Where the month lands, and why
Each forecast line — revenue, expenses, profit, cash position — carries a projection, a likely range, how much has been measured so far this month and a confidence meter. Underneath, plain-English commentary explains the projection in sentences rather than leaving you to read a chart.
Forecast cards show a trend direction, the value against target, a likely low-to-high range and a confidence percentage
Any card can be edited when you disagree — and the tone recalculates, so an edited card can't stay green while it's under target
“What is driving this forecast?” ranks cost categories by share of spend, each linking to the module responsible
Commentary is badged Measured this month or Illustrative, so you always know whether you're reading your data or an example
app.vyso.co.za/planwise/forecast
04
What-if, before you commit to it
Scenarios is a sandbox for the conversation you have anyway: what happens if we grow revenue four percent, or cut waste, or fix the under-target lines. Five sliders map onto the modules that would deliver the change, and the projected outcome recalculates as you move them.
Sliders cover revenue growth, expense reduction, margin improvement, waste reduction and invoice recovery — each tagged to its owning module
Live results show projected revenue, expenses, profit, cash position, runway and the delta against where you are now
A comparison table lines scenarios up on revenue, profit, cash, growth, variance, risk and probability
An AI-generated “best scenario” is on the roadmap; today the sandbox is yours to drive
app.vyso.co.za/planwise/scenarios
05
Numbers that turn into named, costed decisions
A dashboard that only reports is a dead end. The recommended decisions panel on the overview turns the month's gaps into tracked items with a rand value against each — recover outstanding invoices, pull cost of goods back to plan, reprice the below-target products — and routes each one to the module where the work actually happens.
Tracked decisions cycle Open → In progress → Done, with a “Review →” link into the owning module
Freshly derived suggestions appear alongside them and can be promoted to tracked with one action
The panel header totals the value still open against the number completed
The financial flow card traces Revenue → Gross margin → Gross profit → Expenses → Net profit → Cash position, each node linking to its module
How it fits your week
The routine, not the feature list.
Software only helps if it changes what someone actually does on a Tuesday. This is the working rhythm PlanWise is built around.
1
Set the goals first
Revenue, profit, expense ceiling and target margin. These are the figures PricePilot, InsightGen and the rest measure themselves against, so they are worth an hour.
2
Lay out the budget by category
Add the cost lines your business actually runs on. Where a module can measure one — sales, order cost, waste — it will, and mark the line as measured.
3
Check pace mid-month, not month-end
The overview tells you what is over pace today. Being eleven days into the month is no longer an excuse for not knowing.
4
Read the forecast commentary
Plain sentences on where the month is likely to land and why — ahead of or short of target, and which cost category is driving it.
5
Decide, then act in the right module
Track the decision here, do the work where it lives: chase invoices in OrderFlow, reprice in PricePilot, cut waste in WasteWatch.
Works with the rest of Vyso
Connected where the workflow needs it.
These are real data relationships, not a logo wall. Each one describes what actually moves between PlanWise and the module beside it.
Including the parts that are still on the roadmap. You should be able to plan around what exists today, not around a promise.
Is “over budget” measured at month end or as of today?
As of today. Each cost line's actual is compared against its budget pro-rated to the elapsed fraction of the month, specifically so a line can't look fine on the 8th and blow up on the 31st.
Where do the budget and forecast numbers come from — are they manual?
Both. PlanWise stores the plan you set, but measures reality live from OrderFlow sales and invoices, product cost, and WasteWatch events. Where a measured figure exists it is shown alongside the plan and marked as measured.
Does it update when a colleague changes something?
Yes. Budget lines, targets, goals, forecasts and decisions are all watched live, so an edit made elsewhere — including a target changed from the pricing module — appears without a manual refresh.
Can we override a forecast we disagree with?
Yes. Every forecast card is editable — forecast value, target, likely range and confidence — and the trend colouring recalculates from the new figure, so an edited card can't stay optimistic while sitting under target.
Does the scenario builder save scenarios?
Not yet. The sliders, live results and comparison table are fully interactive, but saving a scenario and the AI “generate best scenario” action are still on the roadmap rather than working features today.