InsightGen.Cross-workflow data, turned into reports and alerts.
InsightGen reads the other modules directly — orders, waste, shifts, stock and suppliers — and turns them into a daily brief, a transparent rule-based alert set and CSV exports of the raw rows behind every number.
Every screen below was captured from the running platform with a demo organisation — not drawn as a mockup. The labels, columns and tiles are the ones your team would work in.
01
Alerts that show their working
InsightGen does not pretend to be a model, and says so on the screen: the anomalies are rule-based, not modelled. Six fixed rules run against your own rows, and every card prints the rule and threshold that fired it — which makes an alert something you can argue with, tune or trust, rather than something you have to take on faith.
The rule book is published in the app: food-cost variance, supplier price jump, labour spike, waste spike, low stock and open supplier risk
Each card carries the severity, the module it came from, the metric and value, the rule text, and an acknowledge or reopen action
KPIs cover Open anomalies, Critical, Acknowledged, Rules evaluated and the window in days
When nothing fires it says so outright — margin, supplier pricing, labour, waste and stock are all inside their thresholds
app.vyso.co.za/insightgen/anomalies
02
One feed across every module
The insight feed is where the cross-module picture actually shows up: week-on-week sales, margin against target, waste trend and preventability, labour, stock and supplier risk in one filterable list. Each row is labelled by where it came from — computed live from your rows this request, or stored — so you always know what you are reading.
Filter by module, by severity (Critical, Watch, Info, Positive) and by origin (derived now or stored)
Each row shows a severity dot, the finding, the metric value, and badges for anomaly status and source module
Derived insights are recomputed on every load over the rolling window rather than cached and quietly aged
Export the filtered feed to CSV with severity, module, origin, insight, metric and value
app.vyso.co.za/insightgen/insights
03
Reports that hand you the rows, not a picture of them
The report builder is deliberately unglamorous: choose the datasets, choose the range, preview it and export the raw rows. The CSV is the underlying data with no rounding or summarising applied — which is what makes it useful to a bookkeeper or an accountant rather than only to a dashboard.
Five datasets: Sales lines, Waste events, Labour, Stock levels and Suppliers — each with its real column set and live row count
Scope the selection to the last 7 days, last 30 days or the full window, then preview before exporting
Saved report definitions list Report name, Scope, Modules, Schedule, Last run, Owner and Status, and re-run on demand
Every row came from an org-scoped query against the source module's own table on that request
app.vyso.co.za/insightgen/reports
04
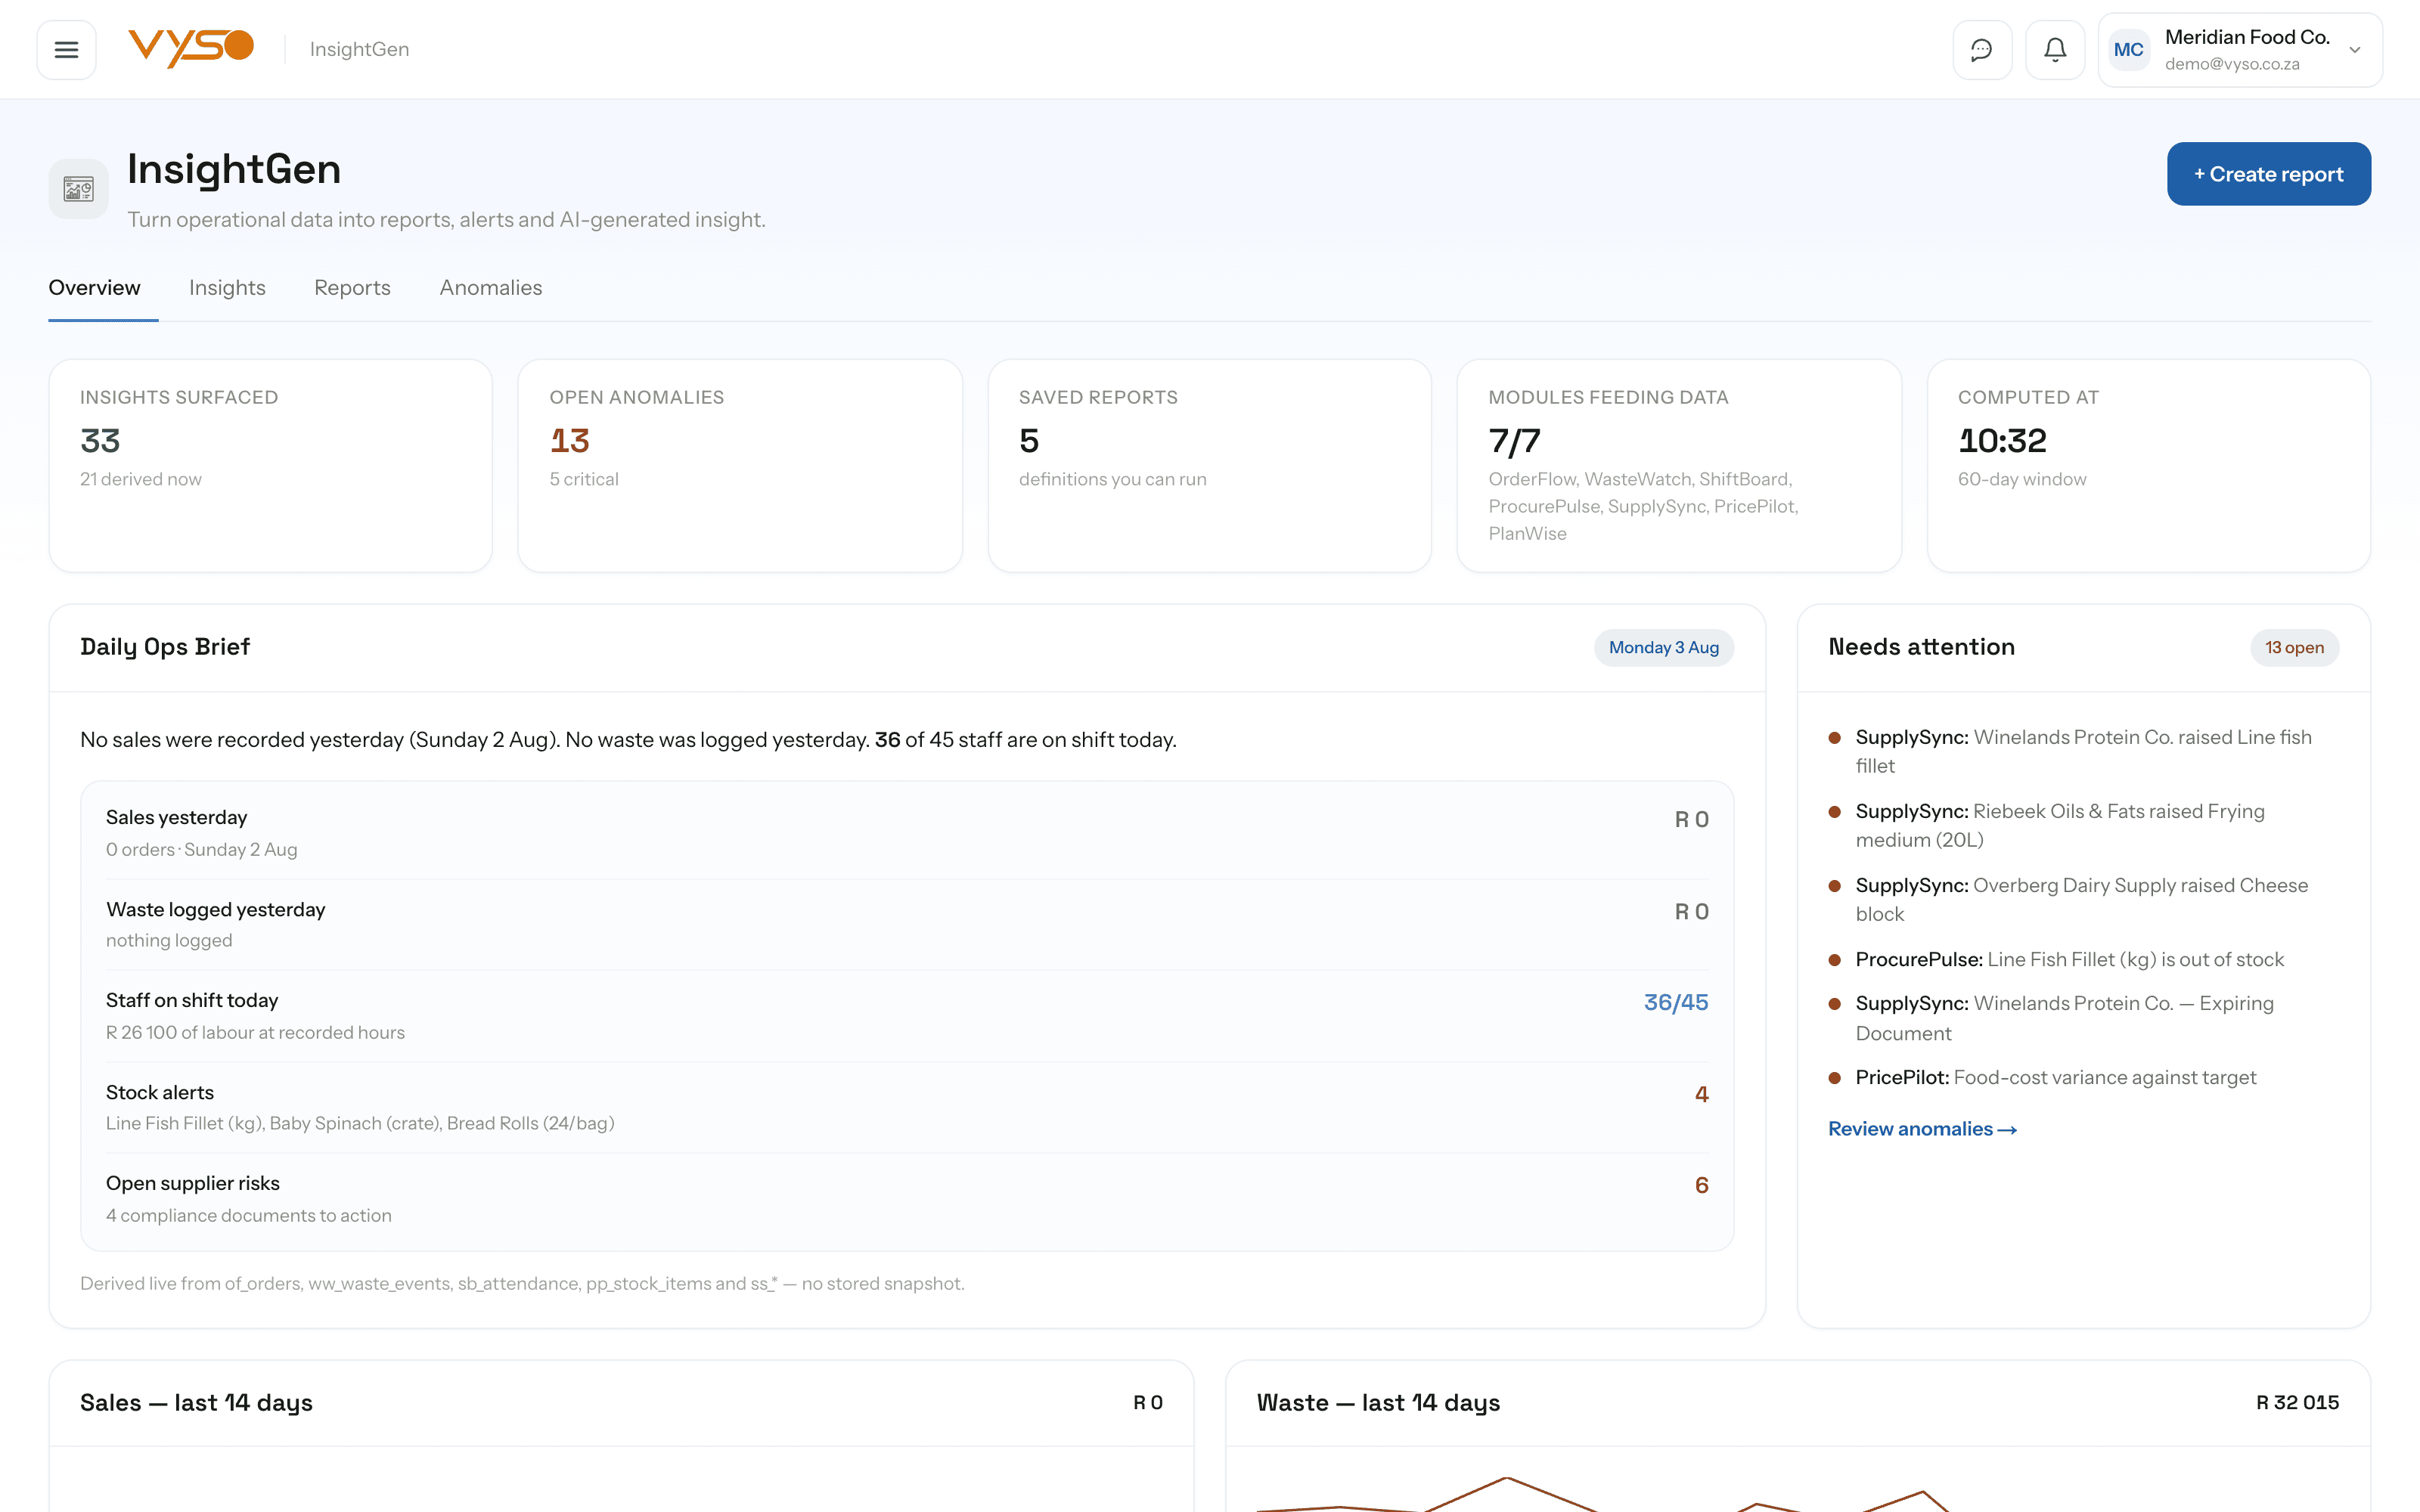
Where the numbers actually come from
InsightGen holds no data of its own worth speaking of. Every figure is recomputed on each page load from the source modules' own tables over a rolling 60-day window, and the overview names them on the screen rather than making you take it on trust. A KPI tile tells you how many of those modules are currently feeding it.
The Daily Ops Brief reads sales yesterday, waste logged yesterday, staff on shift today, stock alerts and open supplier risks
The brief's own footnote names its sources: orders, waste events, attendance, stock items and supplier records — no stored snapshot
A “Modules feeding data” tile shows how many of the source modules are connected, and lists them
Twin 14-day sparklines track sales and waste, each captioned with the derivation behind it
How it fits your week
The routine, not the feature list.
Software only helps if it changes what someone actually does on a Tuesday. This is the working rhythm InsightGen is built around.
1
Read the brief with your coffee
Sales yesterday, waste yesterday, who is on today, stock alerts and open supplier risks — assembled from five modules without anyone compiling anything.
2
Work “Needs attention”
Open anomalies are listed with the module they came from. If nothing fired, the screen says so rather than filling the space.
3
Check the rule before you act on the alert
Each card prints its rule and threshold, so you can tell the difference between a genuine outlier and a threshold set too tight.
4
Acknowledge what you have handled
Acknowledged anomalies drop out of the default view and can be reopened, so the list stays a working queue.
5
Export what the accountant asked for
Pick the datasets and the range, preview, export the raw rows. Save the selection as a definition when it's a report you run every month.
Works with the rest of Vyso
Connected where the workflow needs it.
These are real data relationships, not a logo wall. Each one describes what actually moves between InsightGen and the module beside it.
Including the parts that are still on the roadmap. You should be able to plan around what exists today, not around a promise.
Is InsightGen using AI to find these anomalies?
No, and we would rather be straight about it. The anomalies come from a fixed six-rule book run against your own rows — the app labels them rule-based, not modelled, and prints the rule on each card. Vyso does use AI elsewhere, in document extraction and product matching, but not here.
Which modules does InsightGen need connected?
It reads OrderFlow for sales, WasteWatch for waste, ShiftBoard for labour, ProcurePulse for stock, SupplySync for suppliers and PlanWise for your margin target, with Doc-U selectable as a report scope. A tile on the overview shows how many are currently feeding it.
Can we export the underlying data, or is it only a dashboard?
Every dataset in Reports exports as raw-row CSV — the data itself, not a rendered summary — and the anomalies and insight feeds each have their own CSV export with defined columns.
What happens if we haven't set up the other modules yet?
Every screen has an explicit empty state explaining that InsightGen needs source-module rows before anything appears. Nothing is faked, defaulted or filled with sample numbers.
How far back does it look?
A rolling 60-day window, shown on screen, with the report builder able to narrow to the last 7 or 30 days.